The NEAM Tsunami Hazard Model 2018 (NEAMTHM18; https://doi.org/10.13127/tsunami/neamthm18) is a time-independent probabilistic hazard model for tsunamis generated by crustal and subduction-zone earthquakes. The dataset covers the coastlines of the North-Eastern Atlantic, the Mediterranean, and connected Seas (NEAM).
The metric used for the tsunami intensity is the Maximum Inundation Height (MIH, in meters), calculated by applying local amplification factors (AF) to the offshore maximum tsunami amplitudes obtained at 2,336 Points of Interest (POI) distributed in the North-Eastern Atlantic (1,092 POIs), the Mediterranean Sea (1,107 POIs), and the Black Sea (137 POIs) at an average spacing of ~20 km and an average depth of ~50 m.
We provide the mean hazard curve together with five different percentiles to illustrate the model epistemic uncertainty, namely: the 2nd, 16th, 50th, 84th, and 98th percentiles.
NEAMTHM18 data are distributed through web services adopting the OGC standards (WFS and WMS). This service is part of the candidate Thematic Core Service (cTCS) Tsunami after following the TCS Data Quality Assurance workflow and was then incorporated into the Integrated Core Service Data Portal of the European Plate Observing System (EPOS).
Use the resources listed below to access NEAMTHM18 data.
WFS catalog
https://services.tsunamidata.org/NEAMTHM18/ows?service=WFS&request=GetCapabilities
WMS catalog
https://services.tsunamidata.org/NEAMTHM18/ows?service=WMS&request=GetCapabilities
Style file to recreate the color scale used by the WMS catalog
Download SLD file
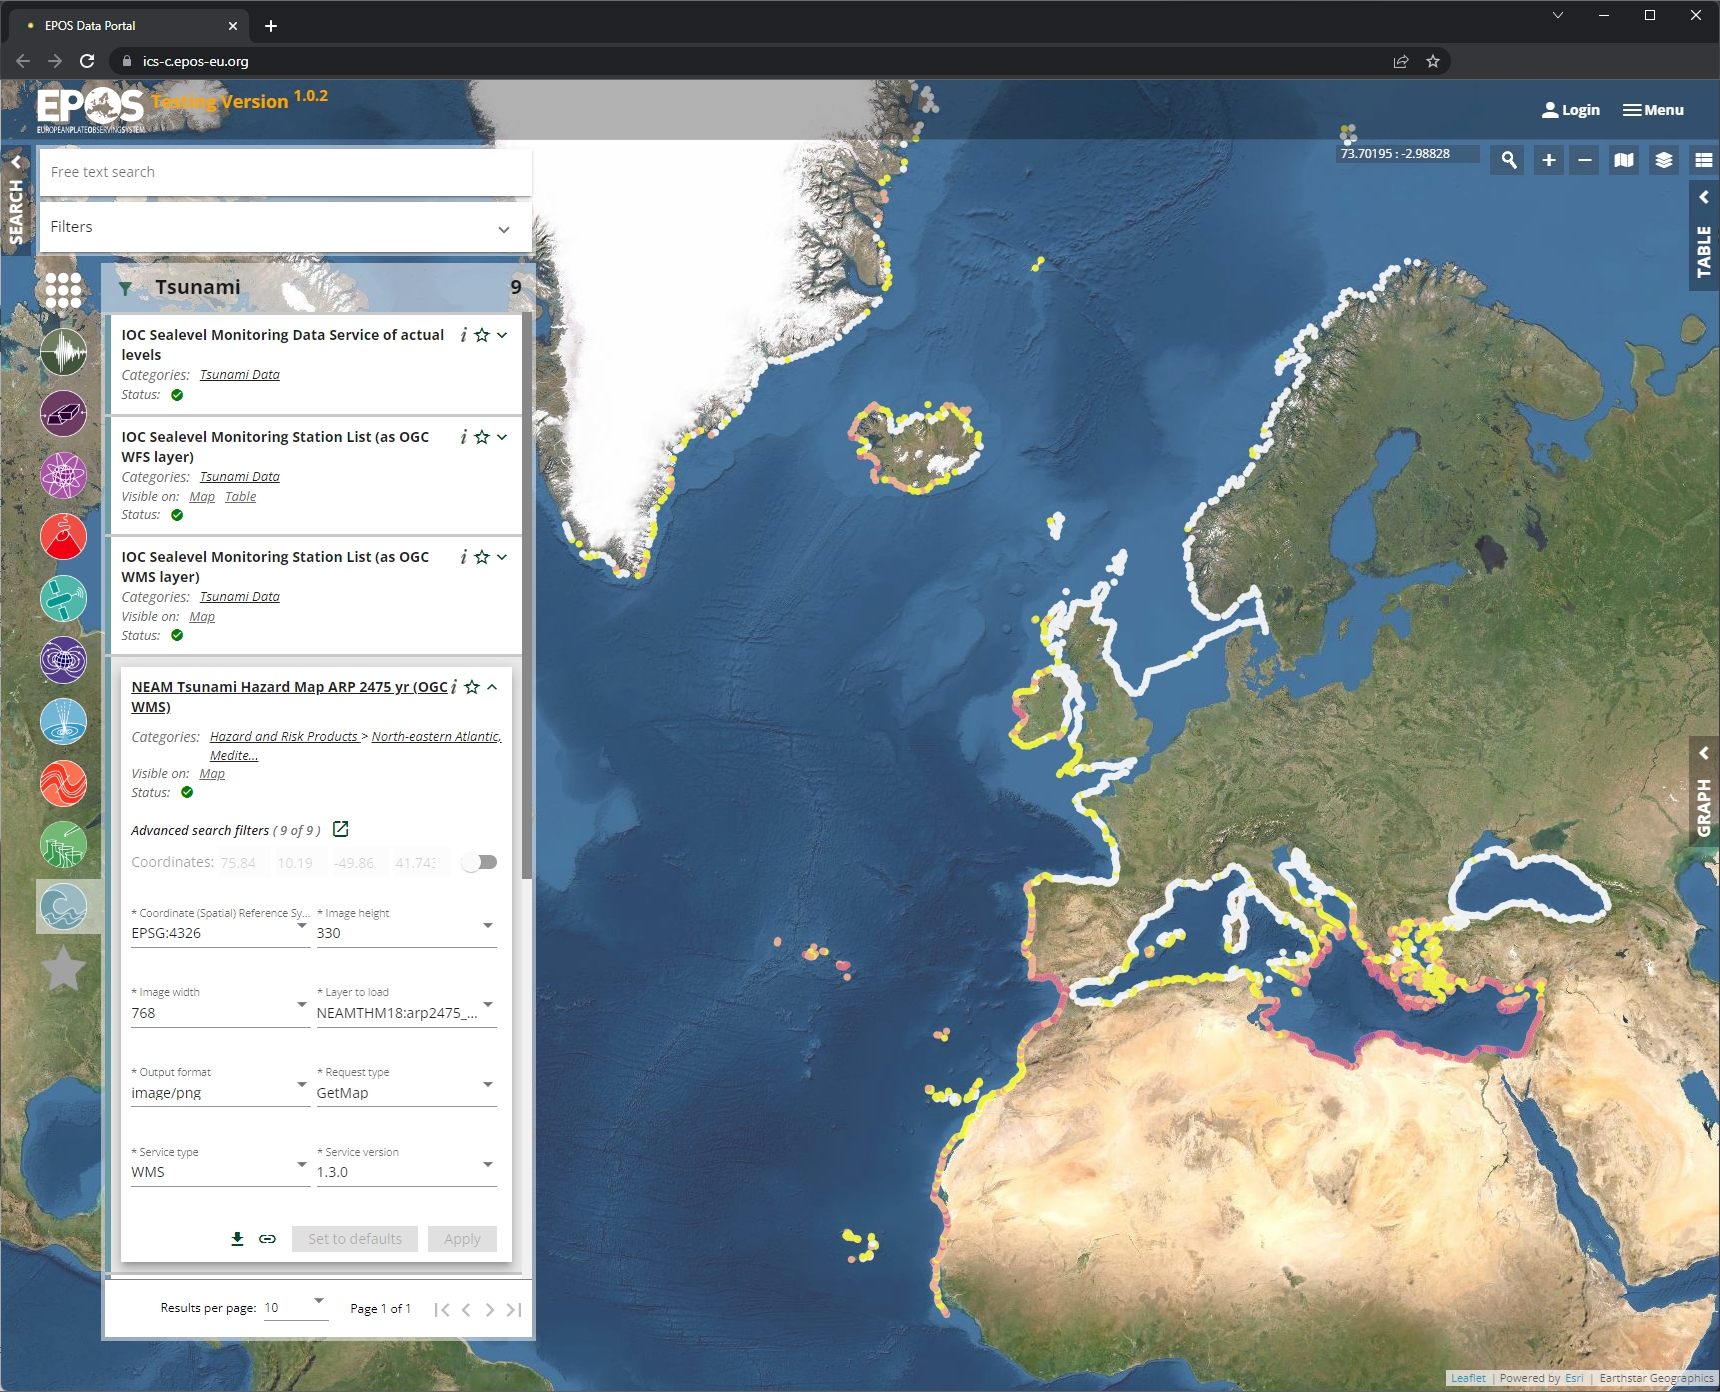
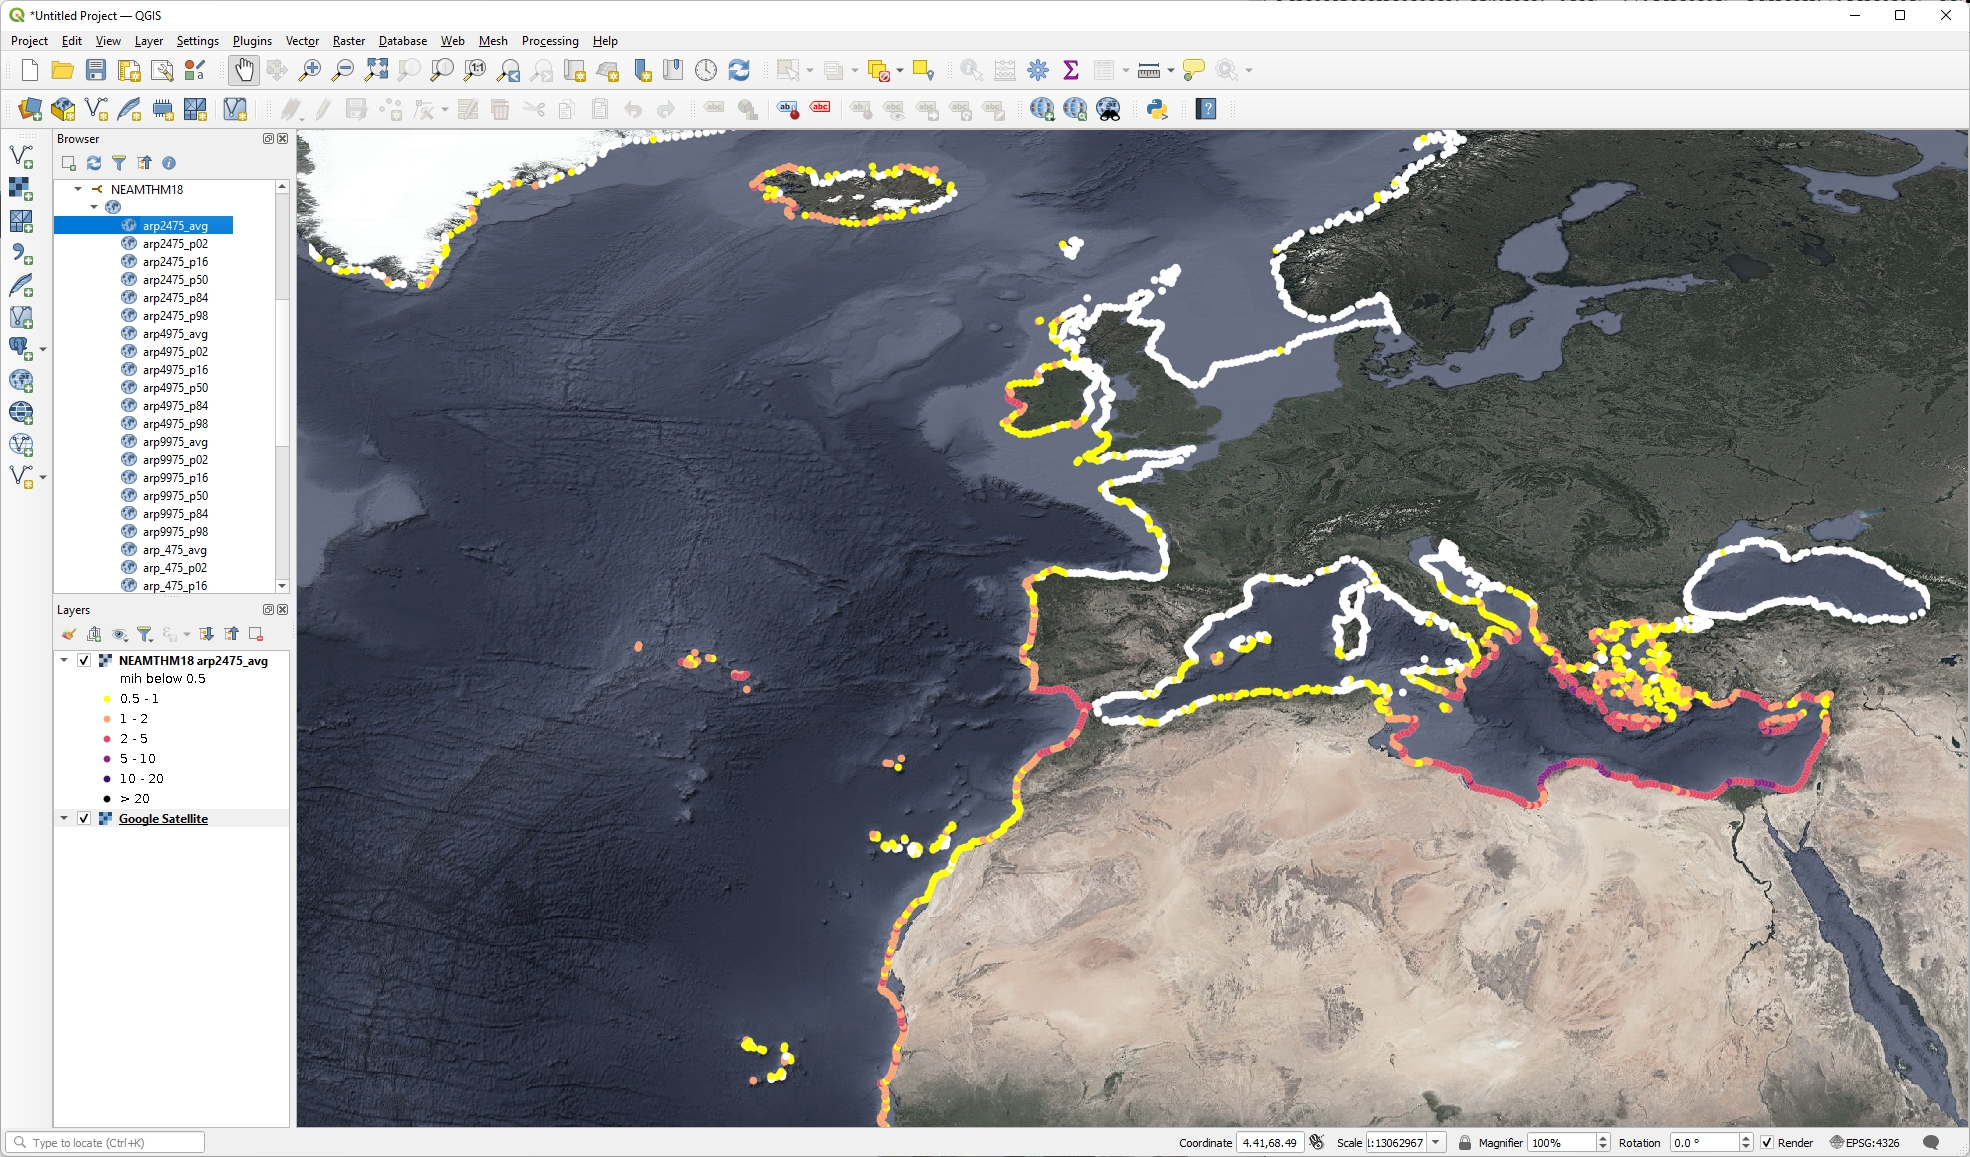
Example views of a NEAMTHM18 WMS layer as displayed by the EPOS ICS-C user interface (left) and as loaded by a desktop user into the QGIS map canvas (right).
WFS catalog. The WFS catalog attribute table consists of 96 columns. The first five columns provide information about the POI. The sixth column provides a link to a plot of the hazard curves at the POI. The following 90 columns provide the MIH values for the given PoE for the six statistical samples (mean and percentiles) of the model uncertainty.
| Column name | variable | units | description |
|---|---|---|---|
| POI | string | n.a. | Identifier of the Point Of Interest formed by a 3-letter code representing the region (blk for Black Sea, med for Mediterranean, nea for North-Eastern Atlantic) followed by an ordinal with leading zeroes (useful for sorting POIs alphabetically) |
| Region | string | n.a. | Name of the basin the POI belongs to (e.g., Black Sea, Mediterranean, North-Eastern Atlantic) |
| Lon | float | decimal degrees | Longitude of the POI, datum WGS84, positive East. |
| Lat | float | decimal degrees | Latitude of the POI, datum WGS84, positive North. |
| Depth | float | meters | Water depth at the POI location |
| hc_link | string | n.a. | Hyperlink to hazard curves for given POI formed by the URL “https://hazardcurves.tsunamidata.org/” followed by the POI identifier. |
| P1E_00avg, P5E_01avg, P2E_01avg, P1E_01avg, P5E_02avg, P2E_02avg, P1E_02avg, P5E_03avg, P2E_03avg, P1E_03avg, P5E_04avg, P2E_04avg, P1E_04avg, P5E_05avg, P2E_05avg | float | meters | Each column reports the MIH value of the mean of the hazard models for the probabilitis of exceedance (PoE) in 50 years equal to 1E-00, 5E-01, 2E-01, 1E-01, 5E-02, 2E-02, 1E-02, 5E-03, 2E-03, 1E-03, 5E-04, 2E-04, 1E-04, 5E-05, 2E-05, corresponding to average return periods (ARP) equal to 0, 72, 224, 475, 975, 2475, 4975, 9975, 24975, 49975, 99975, 249975, 499975, 999975, 2499975 years, respectively. |
| P1E_00P02, P5E_01P02, P2E_01P02, P1E_01P02, P5E_02P02, P2E_02P02, P1E_02P02, P5E_03P02, P2E_03P02, P1E_03P02, P5E_04P02, P2E_04P02, P1E_04P02, P5E_05P02, P2E_05P02 | float | meters | Each column reports the MIH value of the 2nd percentile of the hazard models for the probabilitis of exceedance (PoE) in 50 years equal to 1E-00, 5E-01, 2E-01, 1E-01, 5E-02, 2E-02, 1E-02, 5E-03, 2E-03, 1E-03, 5E-04, 2E-04, 1E-04, 5E-05, 2E-05, corresponding to average return periods (ARP) equal to 0, 72, 224, 475, 975, 2475, 4975, 9975, 24975, 49975, 99975, 249975, 499975, 999975, 2499975 years, respectively. |
| P1E_00P16, P5E_01P16, P2E_01P16, P1E_01P16, P5E_02P16, P2E_02P16, P1E_02P16, P5E_03P16, P2E_03P16, P1E_03P16, P5E_04P16, P2E_04P16, P1E_04P16, P5E_05P16, P2E_05P16 | float | meters | Each column reports the MIH value of the 16th percentile of the hazard models for the probabilitis of exceedance (PoE) in 50 years equal to 1E-00, 5E-01, 2E-01, 1E-01, 5E-02, 2E-02, 1E-02, 5E-03, 2E-03, 1E-03, 5E-04, 2E-04, 1E-04, 5E-05, 2E-05, corresponding to average return periods (ARP) equal to 0, 72, 224, 475, 975, 2475, 4975, 9975, 24975, 49975, 99975, 249975, 499975, 999975, 2499975 years, respectively. |
| P1E_00P50, P5E_01P50, P2E_01P50, P1E_01P50, P5E_02P50, P2E_02P50, P1E_02P50, P5E_03P50, P2E_03P50, P1E_03P50, P5E_04P50, P2E_04P50, P1E_04P50, P5E_05P50, P2E_05P50 | float | meters | Each column reports the MIH value of the 50th percentile of the hazard models for the probabilitis of exceedance (PoE) in 50 years equal to 1E-00, 5E-01, 2E-01, 1E-01, 5E-02, 2E-02, 1E-02, 5E-03, 2E-03, 1E-03, 5E-04, 2E-04, 1E-04, 5E-05, 2E-05, corresponding to average return periods (ARP) equal to 0, 72, 224, 475, 975, 2475, 4975, 9975, 24975, 49975, 99975, 249975, 499975, 999975, 2499975 years, respectively. |
| P1E_00P84, P5E_01P84, P2E_01P84, P1E_01P84, P5E_02P84, P2E_02P84, P1E_02P84, P5E_03P84, P2E_03P84, P1E_03P84, P5E_04P84, P2E_04P84, P1E_04P84, P5E_05P84, P2E_05P84 | float | meters | Each column reports the MIH value of the 84th percentile of the hazard models for the probabilitis of exceedance (PoE) in 50 years equal to 1E-00, 5E-01, 2E-01, 1E-01, 5E-02, 2E-02, 1E-02, 5E-03, 2E-03, 1E-03, 5E-04, 2E-04, 1E-04, 5E-05, 2E-05, corresponding to average return periods (ARP) equal to 0, 72, 224, 475, 975, 2475, 4975, 9975, 24975, 49975, 99975, 249975, 499975, 999975, 2499975 years, respectively. |
| P1E_00P98, P5E_01P98, P2E_01P98, P1E_01P98, P5E_02P98, P2E_02P98, P1E_02P98, P5E_03P98, P2E_03P98, P1E_03P98, P5E_04P98, P2E_04P98, P1E_04P98, P5E_05P98, P2E_05P98 | float | meters | Each column reports the MIH value of the 98th percentile of the hazard models for the probabilitis of exceedance (PoE) in 50 years equal to 1E-00, 5E-01, 2E-01, 1E-01, 5E-02, 2E-02, 1E-02, 5E-03, 2E-03, 1E-03, 5E-04, 2E-04, 1E-04, 5E-05, 2E-05, corresponding to average return periods (ARP) equal to 0, 72, 224, 475, 975, 2475, 4975, 9975, 24975, 49975, 99975, 249975, 499975, 999975, 2499975 years, respectively. |
WMS catalog. The WMS catalog consists of five groups of six layers. Each group represents an Average Return Period (ARP) of 475, 975, 2475, 4975, 9975 years, corresponding to 1e-1, 5e-2, 2e-2, 1e-2, 5e-3 Probability of Exceedance (PoE) in 50 years, respectively. Each layer within each group represents different statistics of the epistemic uncertainty, including the mean (avg) and the following five percentiles: 2nd, 16th, 50th, 84th, 98th (p02, p16, p50, p84, p98).
| Column name | variable | units | description |
|---|---|---|---|
| POI | string | n.a. | Identifier of the Point Of Interest formed by a 3-letter code representing the region (blk for Black Sea, med for Mediterranean, nea for North-Eastern Atlantic) followed by an ordinal with leading zeroes (useful for sorting POIs alphabetically) |
| Region | string | n.a. | Name of the basin the POI belongs to (e.g., Black Sea, Mediterranean, North-Eastern Atlantic) |
| Lon | float | decimal degrees | Longitude of the POI, datum WGS84, positive East. |
| Lat | float | decimal degrees | Latitude of the POI, datum WGS84, positive North. |
| Depth | float | meters | Depth of the POI below sea level |
| MIH | float | meters | Mean value of the Maximum Inundation Height at the POI for the given ARP or PoE. |